How many recessions is that AI-beats-the-60/40 backtest actually built on?
JPMorgan's AI agents beat a 60/40 portfolio in a 20-year backtest, but the edge rests on a genuine business-cycle sample of two NBER-dated recessions, not 20 independent years. Here is how to size that gap before trusting any dynamic-allocation product's track record.
JPMorgan built eight AI agents that beat a 60/40 portfolio in a roughly 20-year backtest, the best by 0.7 percentage points a year at lower volatility. The edge sounds like it rests on two decades of data. It mostly rests on correctly reading a small handful of true regime shifts, and the official US recession count over that span is exactly two. Before trusting any AI-driven allocation product's "beats 60/40" backtest, ask how many real regime transitions it actually contains, not how many years.
This week I read that JPMorgan built eight AI agents, running on language models from OpenAI and Anthropic, and set them loose on roughly 20 years of market history with one job: decide when to hold stocks and when to hide in bonds. Every single one beat a plain 60/40 stock-bond portfolio on a risk-adjusted basis. The best agent added 0.7 percentage points of annualized return while running at lower volatility than the benchmark, according to Bloomberg’s reporting on the bank’s own research note. Twenty years of outperformance sounds like a real edge. I wanted to know what was actually inside those twenty years.
What JPMorgan’s agents actually did with two decades of data
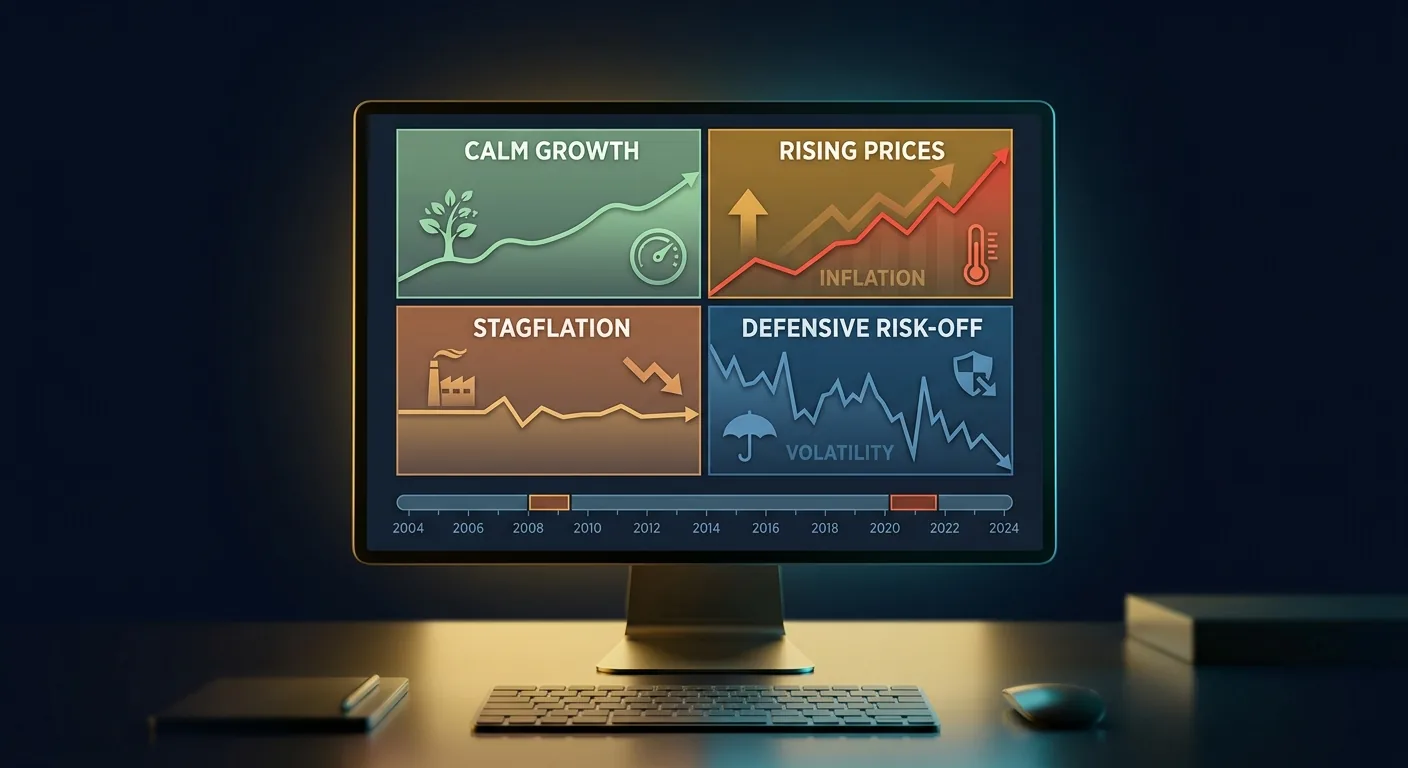
The agents were not stock pickers. They classified the economy into four regimes: Goldilocks (solid growth, tame inflation), Reflation (growth and prices both rising), Stagflation (weak growth with sticky inflation), and Risk-off (defensive positioning), then shifted the stock-bond mix accordingly. Every one of the eight beat both the static 60/40 portfolio and the bank’s own older, rules-based regime model. Genuinely interesting. Also, on its own, incomplete, because the number that matters is not how many years the backtest spans. It is how many times the regime the agent needed to catch actually happened.
| Measure | What the headline implies | What the record shows |
|---|---|---|
| Backtest length | ~20 independent years of skill | ~20 years, same span, most bond-vs-stock edge concentrated around a few turning points |
| Best-agent outperformance | 0.7 percentage points a year, "AI edge" | 0.7 points a year, largely earned by correctly de-risking around rare drawdowns |
| Genuine business-cycle recessions in the window | Implied: many, across 20 years | 2 (officially dated: 2007-2009 and Feb-Apr 2020) |
| 2022 bear market (S&P 500 -25.4% peak to trough) | Should count as a regime event | Never dated as an official recession at all |
Why a 20-year window can still be a small sample
Here is the part that is easy to miss. A dynamic-allocation strategy earns most of its edge over a static 60/40 portfolio by getting a small number of big calls right: de-risk before the crash, get back in after. Over roughly the last 20 years, the National Bureau of Economic Research has dated exactly two recessions: the 18-month stretch from December 2007 to June 2009, and the two-month COVID contraction from February to April 2020. That is the entire universe of officially confirmed “the economy actually broke” events an agent had to catch. The 2022 bear market, a real 25.4% peak-to-trough fall in the S&P 500 that surely tripped any Risk-off classifier, was never dated as a recession at all, because growth reaccelerated before the committee’s own criteria were met. Fit a model to three or four crises and it will look prescient about all three or four. That does not tell you how it handles crisis five.
"An additional 0.7 percentage points in annualized returns while running at lower volatility" than the traditional 60/40 benchmark.
That 0.7-point number is the whole marketable claim. What rarely travels with it is the bank’s own caveat: “the results are based on historical simulations and should not be seen as proof that AI can consistently outperform markets.” That is not modesty. It is the bank naming its own statistical constraint out loud. The same note reportedly added that the strategists are “enthusiastic about the possibilities of agentic AI” while being “wary to hand off asset allocation decision-making to an agent.” This is research-stage work: no announced retail rollout, no live capital behind it yet.
A backtest that spans 20 calendar years but earns its edge from three or four crises is not a 20-year track record. It is a four-event track record wearing a 20-year costume.
What a fair reading of this backtest looks like
None of this means the agents did nothing real. Reading a regime correctly and moving before a drawdown is a legitimate skill, and eight different model configurations landing on the same directional answer is mildly reassuring. But the honest version of the claim is narrower than “AI beats 60/40 by 0.7 points a year.” It is closer to “these classifiers correctly flagged defensive positioning ahead of two confirmed recessions and one uncounted bear market, and we do not yet know how they behave when the signal is ambiguous or the regime is genuinely new.” Smaller, more falsifiable, and the one worth carrying forward.
When any dynamic or tactical AI-allocation product markets a "beats the 60/40 portfolio" backtest, ask how many genuine regime transitions the window actually contains, not how many years it spans. A long backtest built on a short list of crises is not the same thing as a long backtest built on independent evidence.
What I take from this for my own allocation
The decision-useful move is not to dismiss the JPMorgan result. It is to price it correctly. If a robo-advisor, a wealth platform, or a fund pitches a dynamic-allocation product on a multi-decade backtest, the question worth asking your advisor, or yourself, is simple: how many distinct macro turning points does this cover, and did the model see all of them during training rather than being tested on ones it had never met. Edge sizing here is really regime counting. A strategy that is 4-for-4 on real crises deserves attention. It is not yet proven.
I keep coming back to the fact that JPMorgan, with every incentive to lead with the 0.7-point number, published the caution alongside it. Good compliance hygiene, or a genuine acknowledgment that the bank does not trust its own backtest more than the two or three events that built it. Probably both.
This is editorial analysis, not investment advice. Cerevisor does not hold or recommend the named positions, and information here can become stale within hours of publication.
Sources
- JPMorgan AI Agents Beat Traditional Investment Portfolios in Historical Simulations - PYMNTS, 2026-07-10
- JPMorgan tests AI agents for dynamic investment strategies on Wall Street - Cryptobriefing, 2026-07-11
- US Business Cycle Expansions and Contractions - National Bureau of Economic Research
- The Business Cycle Approach to Asset Allocation - Fidelity Institutional
Written by Kinan Hamwi, Founder of Cerevisor.