When vendors break AI revenue records, what does it prove about your AI ROI?
Vendor AI revenue records are dominating board packs this week. Lenovo, Workday, Anthropic, and the hyperscalers are running the same play. None of it is evidence the company's own AI spend has earned anything back. The proof lives on the buyer income statement, not the supplier's.
Lenovo just posted the best year in its 40-year history on the back of 84% AI revenue growth. Workday, Anthropic, and the hyperscalers are running the same play. None of it is evidence the company's own AI spend has earned anything back. The proof lives on the buyer income statement, not the supplier's.
The myth
The myth went viral this week on the back of a single number: 84%. That is how much Lenovo’s AI revenue grew year over year in its Q4 FY26 earnings on May 22, in a quarter the CEO called the best in the company’s 40-year history. By Monday, the leap from that number to a board-level conclusion was already happening in finance committees: AI vendors are growing like this, so the company’s own AI spend must be paying off too.
Read the board pack this week. There is a real chance someone has already added a slide about Lenovo’s print, or Anthropic’s $10.9 billion Q2 forecast, or Alphabet raising its 2026 capex range to $185 billion. The implied conclusion is always the same. The market is racing, we are paying for tickets, the trip will be worth it.
Why it sounds right
It sounds right because the data is real. None of these numbers are made up. Lenovo’s Q4 FY26 revenue was $21.6 billion, AI revenue grew 84% year over year, and AI now represents 38% of all group revenue. CEO Yuanqing Yang declared on the May 22 earnings call that this was the best year in the company’s 40-year history. Anthropic is projecting $10.9 billion in Q2 revenue and a $559 million operating profit, its first ever. Workday’s AI ARR is approaching $500 million, with more than 4,000 customers using a Workday-developed agent, double the count from a quarter ago.
The natural mental shortcut for a board director seeing those numbers is that this is what a market that is paying off looks like. If everyone is buying, somebody must be winning. By extension, since we are buying too, we are winning too.
It also sounds right because we have been here before. In every other technology cycle, supplier revenue eventually correlated with customer return. Big SaaS bookings in 2018 did become real productivity by 2022. For anyone who has sat through enough cycles, pattern-matching to past tech adoption feels reasonable.
What the evidence says
Here is where the pattern breaks. Two analyses from this week point at the same gap.
The first is from 24/7 Wall St on May 24, looking at the XOVR ETF and the capex test heading into summer earnings. The analysis is unusually blunt that valuations in AI infrastructure are being driven by capex trajectory itself, not by demonstrated enterprise customer returns. Spending levels, not measured returns, are the variable that moves stocks right now. As the analyst put it: “If even one hyperscaler trims 2027 capex guidance, NVDA’s earnings power, and by extension XOVR’s largest public anchor, would re-rate fast.” The market is pricing the spend, not the payback.
The second is the bull-case framing CNBC ran on May 21, citing Jefferies analysts on the trillion-dollar AI spending track.
"Cap-ex keeps climbing, but ROI is evident via ~$2 trillion backlog and accelerating cloud growth."
Read that sentence twice. The bull case for AI return is a $2 trillion backlog and accelerating cloud growth. That is vendor revenue evidence. It is not customer return evidence. It says that companies have committed to spending more, not that the companies doing the spending have measured anything coming back.
Now compare against what the buyer side is actually reporting. Recent surveys from Gartner, KPMG, BCG, Grant Thornton, and Microsoft Research all sit in roughly the same band. Somewhere between 6 and 29 percent of enterprises can show measurable financial return on their generative AI spend, depending on which definition of measurable applies. McKinsey’s high-performer cut is even narrower. Only about 5 percent of companies can attribute more than 5 percent of EBIT to AI. The numbers are not moving with vendor revenue. They have not moved much in three quarters.
There is a sharper version of this in a Build Fast With AI roundup from May 23, on Intuit’s announcement that 3,000 jobs will be cut while $500 million of annualized cost savings is booked. The analyst observation was that cost savings accrue to shareholders and AI infrastructure vendors immediately, while retraining and reemployment timelines are longer and less certain. Displacement ROI is being measured. Transition cost is not. The asymmetry shows up at the macro level too. Vendors are measuring what arrives at their cash register. Buyers do not have the same discipline on what leaves theirs.
The reframe
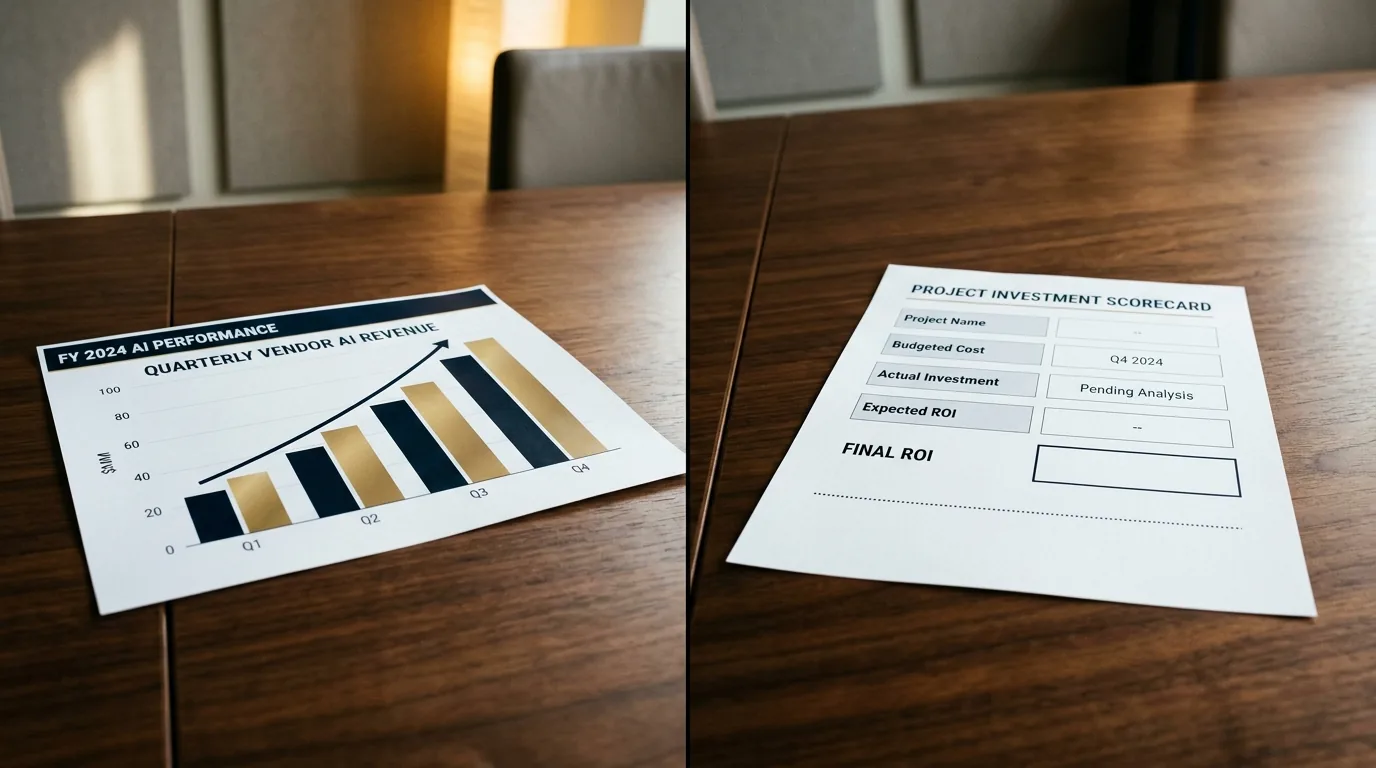
Here is the reframe worth bringing to the next board prep. Every dollar Lenovo books as AI revenue this quarter is a dollar another company books as AI spend. The proof that the spend earned its cost back lives on the buyer income statement, not the vendor’s. Vendor revenue trajectories belong on the supplier-risk slide, not the value slide.
Confusing vendor AI revenue growth with your own AI ROI is the activity trap moved up one floor. Instead of conflating internal adoption with internal value, we are now conflating external supplier success with internal value. The category is wrong.
It is a category error, not a small one. And it is showing up in board conversations right now because vendor earnings season is louder than buyer measurement infrastructure. Vendor success is broadcast in 15-minute earnings calls with press releases attached. Buyer measurable return does not come with a press release.
The cleanest way to break the conflation is to keep them on different slides. If vendor health matters to the strategy because of supplier concentration, dependence, or pricing leverage, that is a real conversation. Put it on a slide about supplier risk. If the question is whether AI is paying off for the company, the only data that belongs on that slide is what changed inside the company.
So what
For the next 90 days, the Q3 board pack reframe is a single page, four lines.
What was spent on AI this period, in dollars, including infrastructure, licences, services, and engineering time. What specific workflows the spend was expected to change. What changed in measurable terms, in margin, cycle time, revenue per FTE, error rate, or customer outcome. What was shut down because it did not earn its cost.
That is the value slide. If anyone wants to talk about Lenovo’s best year in 40 years, that is a different slide. Both can be true. Lenovo can be having a record year and the company can still sit in the unmeasured majority. The category matters more than the news cycle this week. The board members who learn the distinction in May are the ones worth keeping on the audit committee in October.
Sources
- Lenovo shares jump 15% on record earnings as AI revenue nearly doubles - CNBC, 2026-05-22
- XOVR ETF: Watch Hyperscaler AI Capex Before Summer 2026 Earnings Season - 24/7 Wall St, 2026-05-24
- AI spending expected to top $1 trillion in 2 years. Why that estimate may be too low - CNBC, 2026-05-21
- AI News Today - May 23, 2026: 12 Biggest Stories - Build Fast With AI, 2026-05-23
- Workday (WDAY) Q1 earnings report 2027 - CNBC, 2026-05-21
- Anthropic Projects $10.9 Billion Q2 Revenue And First Ever Profit - Dataconomy, 2026-05-21